Seizure Detection
“Seeing the Unseen” with tEEG
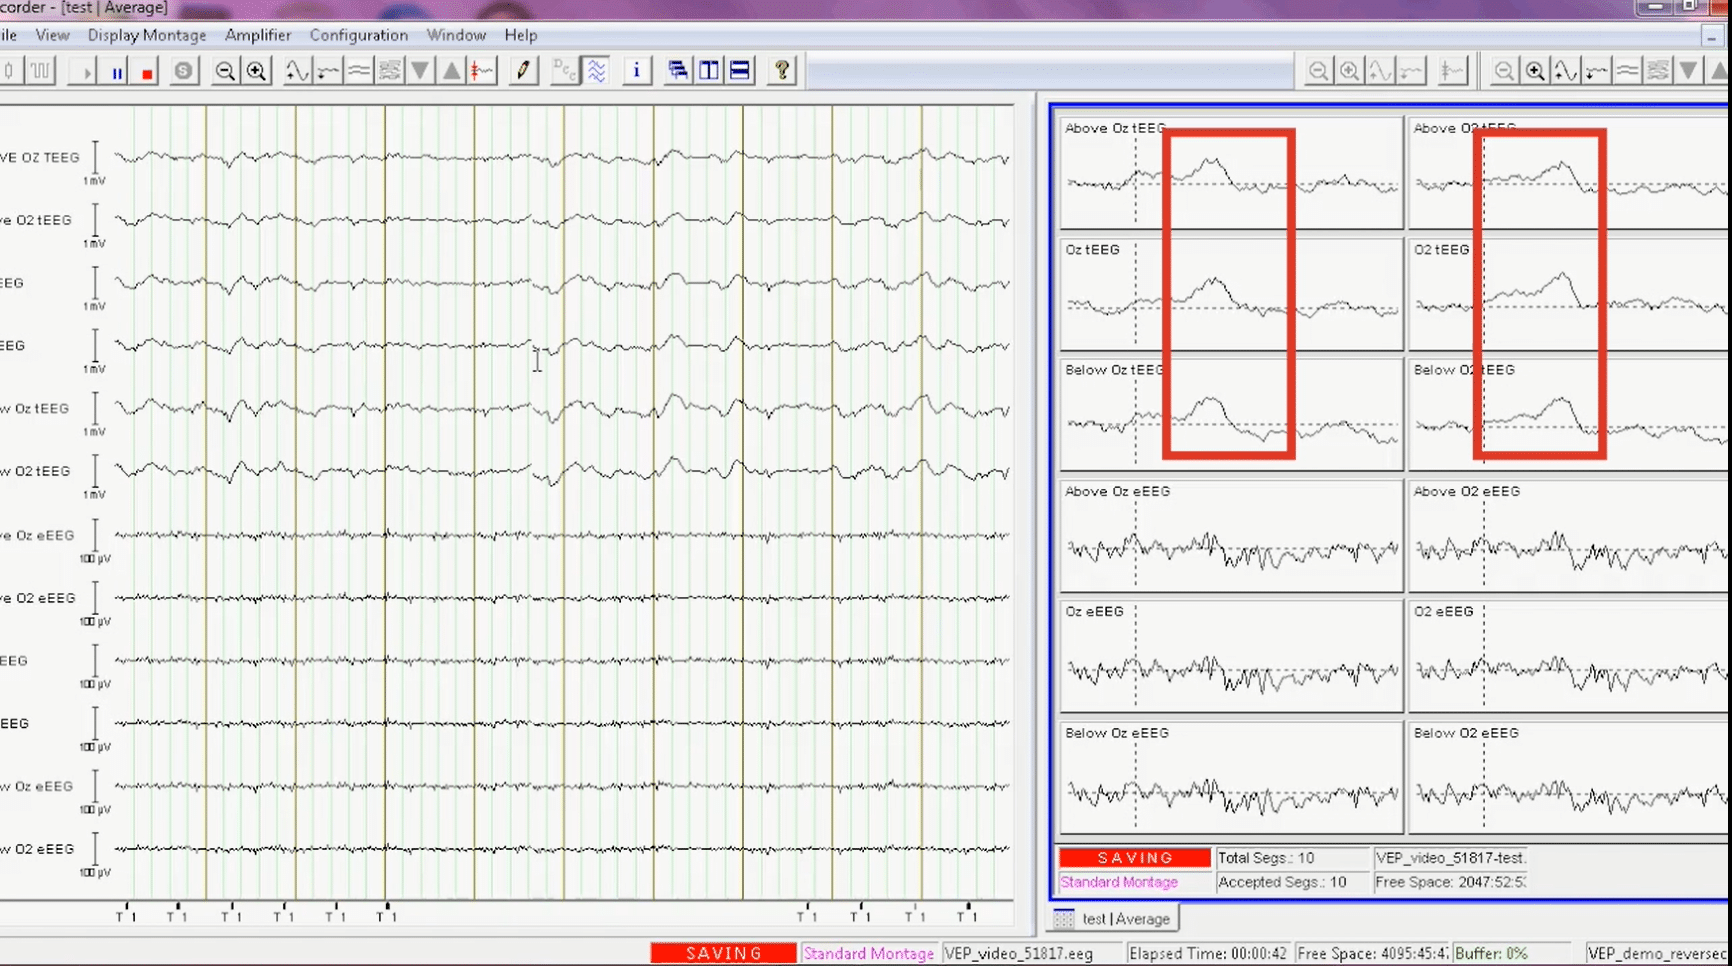
The figure below compares the EEG and tEEG simultaneously recorded from a patient with epilepsy. The onset of a seizure was seen in the tEEG, but was unobservable in the EEG which shows artifacts at the same time.

Biomarker Detection
Detection of New Epilepsy Biomarkers with tEEG
The increased signal fidelity from tEEG may allow detection of biomarkers that can be used to quantify various neurological disorders noninvasively from the scalp surface, which was not previously possible.
High-frequency oscillations (HFOs) are a promising new biomarker in epilepsy. The onset of seizures often is characterized by HFOs at 35 to 500 Hz near the region of seizure origin. Good surgical outcome for epilepsy has been shown to correlate well with HFO localization. However, it is very difficult and unreliable to record HFOs with noninvasive scalp EEG. Most HFOs are recorded on invasive intracranial EEGs, but intracranial EEG is a highly invasive and costly procedure, with significant risk to the patient. The high fidelity provided by tEEG suggests that spike, seizure, and high frequency activity detection could be enhanced with tEEG. We proved such feasibility with our noninvasive scalp tEEG as it identified high frequency activity (HFA) from five minutes to an hour prior to the seizure onset in all the patients from whom we recorded seizures. Our observation of HFA as high as 425 Hz from the scalp surface utilizing tEEG is groundbreaking. We find it remarkable that our preliminary research shows that the HFA in tEEG correlated the seizure onset zone (where a seizure is thought to originate from) or the irritative zone (when there is no clear seizure onset zone) with the clinical diagnosis nearly 80% of the time [Besio et al. 2014]. These early results are very encouraging, provocative, and clearly worthy of follow up. The ability of tEEG to consistently detect HFA in a select few locations that correlate with the clinical diagnosis prior to seizures would meaningfully enhance epilepsy diagnosis and treatment.

A representative example of simultaneously recorded EEG and tEEG from a 42-year-old female patient with epilepsy. Conventional EEG is shown in panels B, F and I (bipolar montage, channel F8-F4, 1-100 Hz, 200 S/s). tEEG is shown in panels D, H and J (from a TCRE placed right behind the F8 position, 1-100 Hz, 200 S/s). The corresponding spectrograms are shown in panels A and E for EEG, and panels C and G for tEEG, starting ~10 min before and continuing during a generalized seizure with onset marked with the dashed vertical black line. Seizures are identified by marked increases in signal amplitude and power at all frequencies. Panels E and F show 11-second EEG segments and panels G and H show 11-second tEEG segments at higher temporal resolution. There are a series of high gamma-band HFOs at 60-80 Hz (highlighted by ellipse in panel C) occurring about every 2 s. These HFOs are clearly seen in the tEEG spectrogram, but not observable in the EEG spectrogram. In panels I and J, further zoom-in of two-second segment shows one HFO in tEEG (red box in panel J). In contrast, this HFO is absent in EEG (panel I). [Figure from IEEE JTEHM Besio et al. 2014]
Brain Computer Interface (BCI)
Improve accuracy
BCIs are systems that detect changes in brain signals related to human intentions, typically translating intention into a control signal to communicate between the brain and the external world. tEEG-based BCI has demonstrated higher accuracy than EEG-based BCI.
In one publication [Boudria et al. 2014], we compared EEG vs. tEEG for one-dimensional (imagined movement and rest) BCI real-time center out cursor control in human subjects. We found that, with tEEG, there was 15% improvement in accuracy after minimal training during the first session (ANOVA, p<0.0001).
In another publication [Besio et al. 2008], using just two TCREs, we correctly classified two dimensional (left or right) single-event imagined movements off line. There was 16% improvement in classifying imagined movements with tEEG compared to EEG (ANOVA, p<0.0001).
The figure below is a plot of electrode locations (left vertical axis) and frequencies (horizontal axis) for one participant. We calculated the statistical difference for the distribution of frequency amplitudes at each location and frequency (i.e., values of r², which indicated the proportion of values that were accounted for by the task; the higher the r², the better the fit of the data to the task.)
The largest r² value in the selected frequency band appeared in the C1 electrodes located on the left motor cortex, as expected from right hand imagined movements. There was a better correlation between imagined right movement and the tEEG signals than the EEG signals, evidenced by the higher r² values for the tEEG.
There was a grand average hit rate of 70% for tEEG and 59% during the first session for participants who had previously never used a BCI [Boudria et al. 2014].
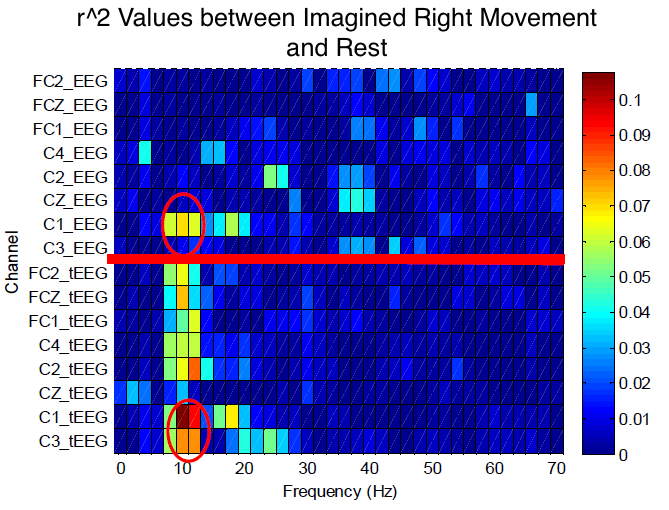
Values of r² for all the electrode locations and frequencies for both EEG and tEEG signals for a “right” hand imagery. The higher the r², the better the fit of the data to the task. Locations above the red line are EEG and below are tEEG. tEEG has larger r² than EEG, therefore a better fit. The red ovals show the highest r² values for approximately 10 Hz at the C1 locations. [Boudria et al. 2014]
Neuromodulation
The Anticonvulsant Effect of TFS
Noninvasive TFS via CREs has been shown to reduce or abolish electrographic and behavioral activities in animal models of seizures and status epilepticus (SE), a severe form of seizures, with long-lasting effects. [Besio et al. 2007, Besio et al. 2010, Besio et al. 2011, Makeyev et al. 2012, Besio et al. 2013, Besio et al. 2013 and Makeyev et al. 2013]. To our knowledge, no other noninvasive, or even invasive, neurostimulation methods have demonstrated similar preclinical efficacy.
The anti-seizure effects of TFS were found to be associated with a significant reduction in the number of degenerated neurons in the hippocampus [Besio et al. 2013].
Further, TFS was found to be safe on the scalp [Besio et al. 2010], hippocampus [Besio et al. 2013], and to not affect short- and long-term memories [Rogel et al. 2013, Luby et al. 2014].
")
TFS via CREs abolished pilocarpine induced status epilepticus (SE)
Modulation of Neurotransmitters with TFS
TFS delivered through the CREs on the rat skull significantly decreased the extracellular concentration of glutamate, a primary excitatory neurotransmitter, and significantly increased gamma-aminobutyric acid (GABA), a primary inhibitory neurotransmitter (Figure below). Epileptic seizures have been associated with a chemical imbalance between excitatory and inhibitory neurotransmitters. In fact, clinical studies indicate that pharmacoresistant temporal lobe epilepsy (TLE) is related to a failure of neurotransmission mediated by glutamate and GABA. High frequency deep brain stimulation (DBS) was found to increase both extracellular glutamate and GABA, which is not optimal in rats. To our knowledge, there were no prior reports of decreasing glutamate and increasing GABA with the same stimulation. It is exciting that TFS changed these neurotransmitters in opposite directions [Besio et al. 2011, Santana-Gómez et al. 2015] and even significantly decreased glutamate during SE [Santana-Gómez et al. 2015].

